
What does a subway stop cost? Measuring Stop the Stop's 50 seconds
Data: an archive of the MTA’s subway feeds, 21 weekdays in September 2026 (Labor Day dropped), ~4.9M stop events. Run 2026-10-02.
Stop the Stop had to assume a stop costs riders 50 seconds (dwell, braking, speeding back up), because the MTA doesn’t publish it. Every hour saved scales with this number, so it’s their weakest input. We can measure it.
Answer
Section titled “Answer”| Where | Stop cost | How |
|---|---|---|
| J/Z, rush hour | 33 s (95% CI 30–35) | Skip-stop comparison, 24 stations |
| J, rush hour | 30 s (CI 20–49) | Distance regression |
| L, rush hour | 61 s (CI 55–65) | Distance regression |
| L, midday | 66 s (CI 55–71) | Distance regression |
| 3 Av on the L | ~42 s eastbound, ~62 s westbound | Observed time with the stop vs. L line without |
| 1 / 7 / A / G / N | 50 / 48 / 56 / 39 / 55 s | Distance regression |
Stop the Stop’s 50 s holds up for the L. Taking the two directions together, 3 Av costs riders about 50 s per train. The line-wide L figure (61 s) is higher. Their assumption is about right and, if anything, low for the L, so their 1,824 rider-hours stands. Their sweep of 20–90 s already covers everything we found.
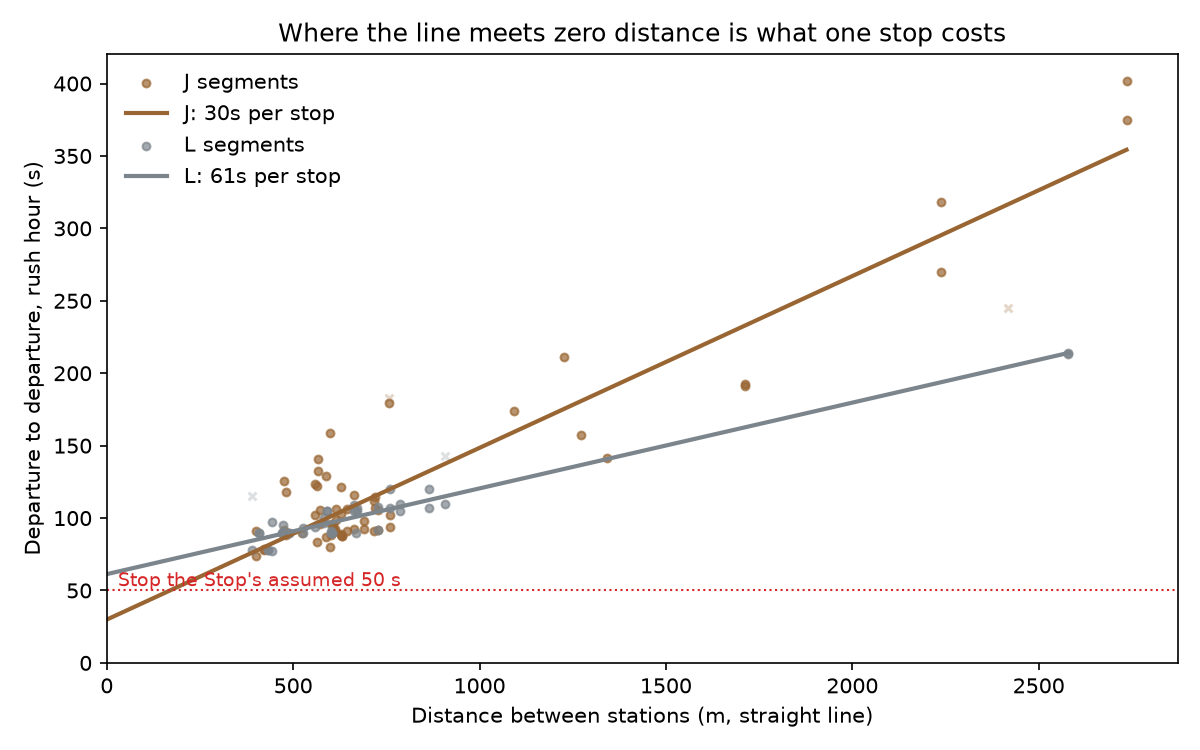
The J costs half what the L does per stop. We don’t know why yet. The J is an old elevated line, and the L runs CBTC; one guess is that CBTC’s cautious braking adds time at each station, but busier platforms could explain it too. It’s worth chasing in its own right.
Method
Section titled “Method”What the data really holds. the archive’s arrival_time and departure_time are the MTA’s last prediction before the train left, not observations. 85% of rows have departure equal to arrival, so the file records no dwell. The observation is marked_past: the first feed snapshot in which the stop had dropped off the trip, just after the train left. (We checked this in the ETL source.) Snapshots come about every 15 s, so one time can be off by up to 15 s. We use trimmed means over hundreds of trains, which cancels this out.
1. J/Z skip-stop (natural experiment). In rush hour J and Z trains share one track and each skips alternate stations by schedule. For stations A > B > C on the same track, in the same hour, compare the A-to-C time of trains that stop at B with trains that pass it. The gap is what the stop costs. 24 stations, each with 50+ trains in both groups, give 28–44 s, centred on 33 s.
2. Distance regression. For each station-to-station segment on a line, take the mean departure-to-departure time and fit time = stop cost + distance / speed. The intercept is the fixed cost of one stop. On the J this gives 30 s, matching the natural experiment, which is why we trust it on other lines.
3. 3 Av directly. Add the observed Union Sq→3 Av and 3 Av→1 Av times, then subtract what the L fit predicts for one 877 m run with no stop.
Caveats
Section titled “Caveats”- Westbound 3 Av is inflated. Trains queue to get into Union Sq and 8 Av, the terminal. Closing 3 Av would move that wait, not remove it. Eastbound (42 s) is the cleaner figure.
- Only scheduled skips count. Many other “skips” in the data are trains that stopped but whose stop dropped out of the feed. They pull the average to near zero, so method 1 uses J/Z only.
- Skip-stop is a lower bound. A J that skips a station can catch the train ahead and be held at a signal, so its gain is smaller than a free run’s.
- Straight-line distance. Curves make the real track longer. That mostly changes the slope, not the intercept.
- The L fit leans on one long point (Bedford Av to 1 Av under the river). Fitting only short L segments gives 60 s, so the result holds.
- One month only. Rerun with more months to check seasonality and service changes.
Every line and station
Section titled “Every line and station”- System average: ~52 s per stop (weighted by segments). The median station is 55 s; the middle half fall between 33 and 78 s.
- By line, most land between 40 and 70 s. Short-dwell lines: J 30, G 39, 7 47, D 48, 1 50. Long: L 61, C 64, 3 65, F 66, B 67, E 70.
- Fits to ignore: 6 (2 s), Q, M, R (91 s at an impossible 132 km/h), SI, W. These lines mix express and local running under one route ID or have odd long segments, and their confidence intervals are wide.
- 3 Av on the L: 52 s, averaging both directions. That is almost exactly Stop the Stop’s 50.
- Costliest “stations” are really junctions: DeKalb Av and Grand St on the B/D/Q/R (Manhattan Bridge merges), Atlantic Av, 149 St-Hostos and Franklin Av (2/5). The 150–300 s there is trains held for a merge, not dwell. The station table doubles as a map of where trains wait.
- Negative values at a few stations are noise: the line fit runs slow for those segments.