
Subway slow zones, 2022–2026
Checked against news: Slow zones: checks against the news. Data: subway feed archive, weekdays April 2021 – October 2, 2026. Run 2026-10-04.
Boston’s TransitMatters slow-zone tracker pushed the MBTA into publishing its own slow-zone data and fixing them. The MTA publishes no list of NYC speed restrictions. This is a first version of one.
Method
Section titled “Method”- Segment times. For each train, the time from leaving one station to leaving the next (
marked_past; includes dwell at the second). This is 1,263 directional segments. - Daily figure. Weekday trains 6:00–21:59, trimmed mean (10th–90th percentile). A median would jump in 15 s steps, because times arrive at the feed’s refresh rate.
- Baseline. 10th percentile of the segment’s daily figure over the previous 120 weekdays: a good typical day, which adapts only to changes lasting months.
- Slow day. At least 10% and 10 s over baseline, with 20+ trains. Slow zone: 4+ slow weekdays in a row (one gap day allowed).
- Kinds. Slow zone: median extra time up to 2 min and 150%. Disruption: more than that. System-wide change: 15+ zones starting the same day (timetables, network-wide events). Service change: the lines using the segment differ from the 60 weekdays before, or the segment is new (route swaps, reroutes, reopened stations). Checking against the news showed these are common.
- Cost. Extra seconds × trains, as train-hours; and extra seconds × riders passing through, as rider-hours. Riders come from routing every station-to-station trip in the MTA’s 2025 origin-destination estimates (3.66M weekday daytime trips) along its fastest path.
- Reported from 2022. Baselines in 2021 come from near-empty pandemic trains, so the 2021 ridership return looked like hundreds of slow zones.
Results
Section titled “Results”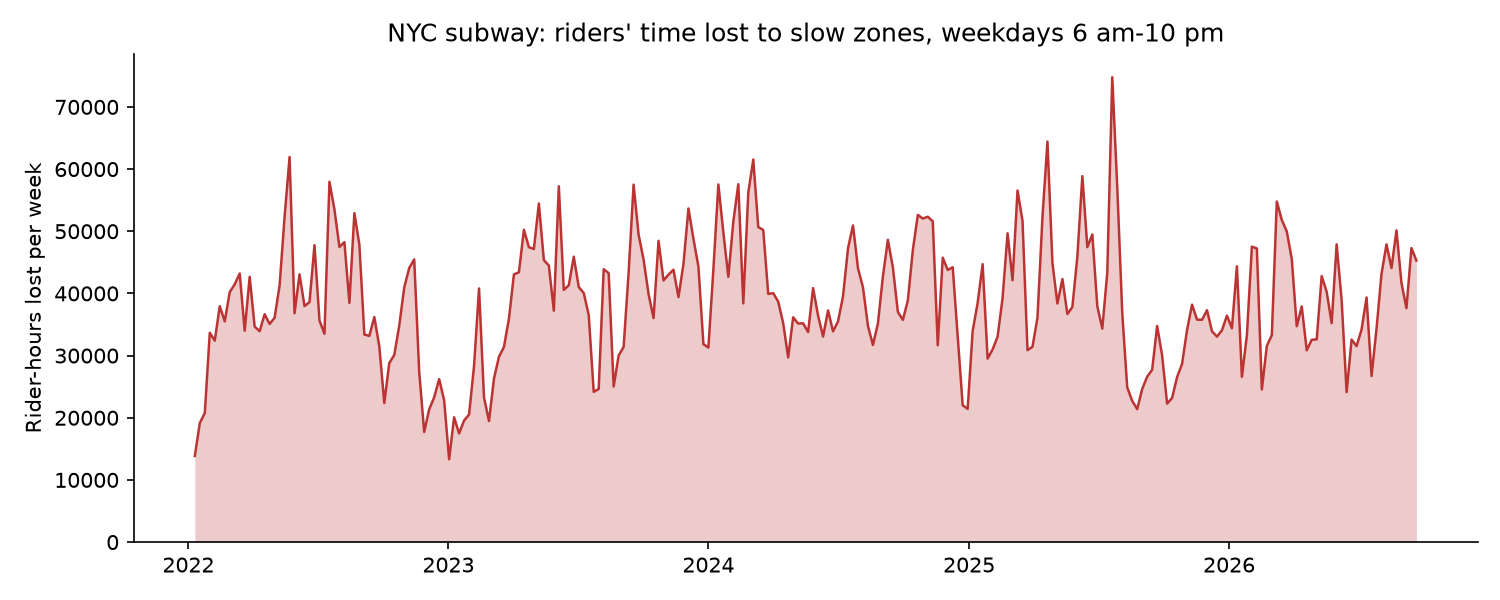
- Slow zones cost riders about 2 million hours a year (weekdays 6 am–10 pm): 1.87M in 2022, 1.98M in 2023, 2.20M in 2024, 1.98M in 2025. Right now it’s about 8,600 rider-hours each weekday across 109 active zones.
- 7,635 slow zones since 2022; 603 cost 25+ train-hours each. A further 1,068 were set aside as service changes and 1,653 as system-wide changes.
- Biggest since 2022: E Roosevelt Av → Queens Plaza (Apr–Jul 2023, +50 s on ~141k riders a day, 124k rider-hours); F through the 63 St tunnel (Aug 2023–Jan 2024, 110k); 6th Av express 42 St → 47–50 Sts (Aug 2023–Jan 2024, 88k).
- Active now, top 3: N/W Queensboro Plaza → 60 St tunnel (+50 s since Jun 8), R Queens Plaza → 60 St tunnel (+62 s since Jun 1), 7 40 St → 46 St (+34 s since May 25).
Validation
Section titled “Validation”Searching news and MTA notices for 13 detected zones found a matching cause for 7, often to the day (details):
- Real slowdowns: the 7 at 40–46 St (temporary platforms from May 25, 2026, same day); Broadway–Lafayette → W 4 St (switch work from May 15, 2023, same day; the MTA warned of ~2 extra minutes).
- Service changes, now filtered out: the M into the 63 St tunnel (F/M swap, Dec 8, 2025); Clark St (station reopened May 4, 2022, so trains stop again).
- Work-related congestion, still counted: 6th Av at 42 St during the 63 St tunnel work. Riders really lost that time, but it wasn’t a speed restriction.
- No source found: the N/R/W 60 St tunnel zones (June 2026), the D at Norwood, the 6 at Grand Central (2022).
Caveats
Section titled “Caveats”- Run time includes dwell. A segment can look slow because platforms got busier, not because of a speed restriction. A step change is the tell; slow drift is less clear-cut.
- “Track point” segments (e.g. R60, the 60 St tunnel) are timing points the feed reports between stations.
- One stretch of slow track shows up as several zones, one per segment and direction. These aren’t merged yet.
- Same-day bursts are set aside, but some may be real, for example a timetable change that adds running time. (The N/R/W Lexington Av/59 St zone from June 29, 2026 was set aside this way.)
- Rider counts are 2025 averages, routed by fastest path with no waiting time, which sends too many riders to express lines.
- Some “slow zones” are work-related congestion (extra trains merging, terminals under construction) rather than speed restrictions. The page says “running slower than usual”, not “speed restriction”.
- Not checked against MTA records of actual speed restrictions, which aren’t published. Confirming a sample of zones with riders, news reports or MTA board books would strengthen it.