
Where buses lose time, and where the bus lanes aren't
Data: the MTA’s bus speeds between timepoint stops (weekdays, March–August 2026), NYC DOT’s bus lanes (updated April 2026), MTA bus ridership by route. Run 2026-10-05.
Method
Section titled “Method”The MTA publishes, for every route, how long buses take between consecutive timepoint stops, by hour. For each stretch:
- Time lost = average time 7 am–7 pm minus the average in the stretch’s fastest hour (with 20+ buses over the six months), roughly how fast buses go on a clear street. Times the number of daytime buses gives bus-hours lost per weekday. That’s time buses spend stuck in traffic and at crowded stops beyond what the street allows when it’s empty.
- Bus lane coverage = the share of the stretch’s path (cut from the route’s GTFS shape between the two stops) within 15 m of a DOT bus lane.
- By street: when both stops of a stretch are on the same street (FLATBUSH AV/EMPIRE BLVD → FLATBUSH AV/ATLANTIC AV), the stretch counts for that street, across routes and directions. Boroughs come from where the stretch is, not the route’s home borough.
Results
Section titled “Results”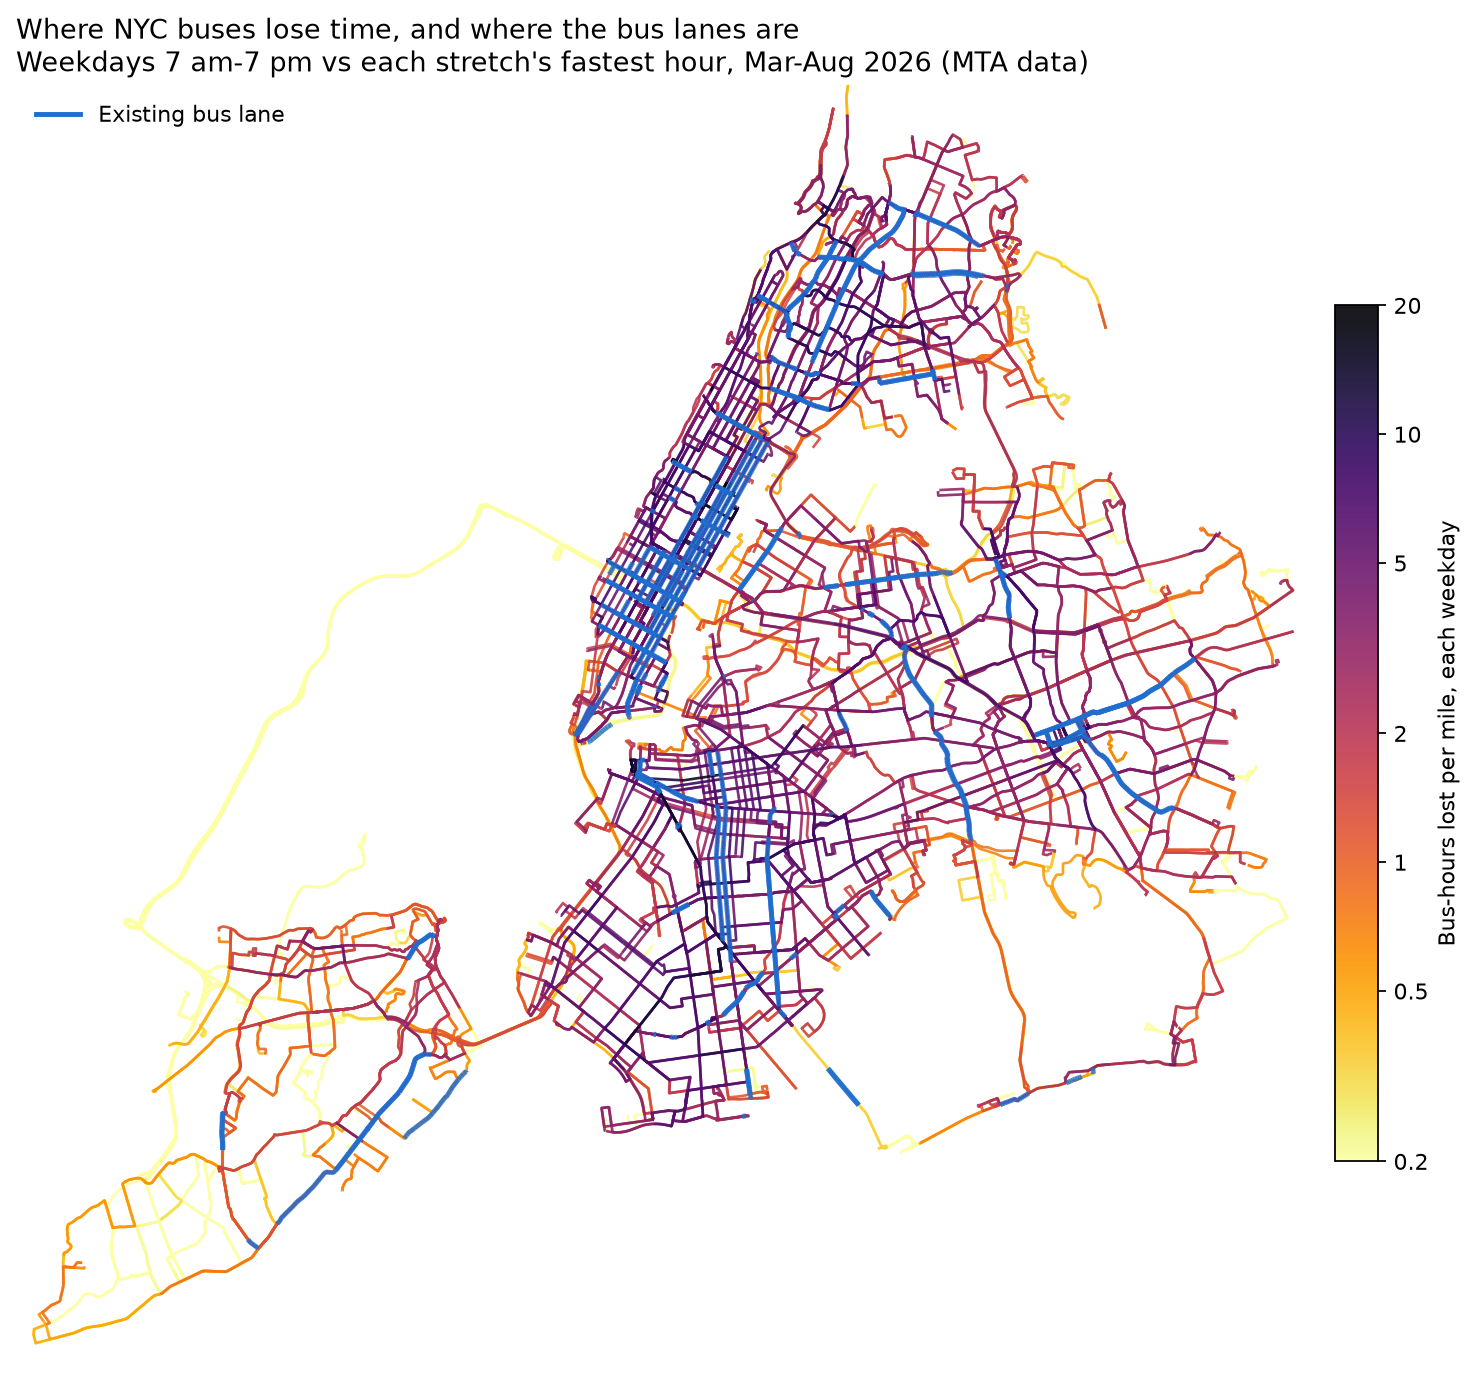
- Buses lose about 10,500 bus-hours every weekday between 7 am and 7 pm.
- 80% of it is on stretches without a bus lane (8,400 bus-hours, over 6,400 route-miles); 2,000 bus-hours are on stretches that have one (960 route-miles).
- Stretches with bus lanes are still slower (6.9 vs 7.9 mph). Lanes were put on the slowest streets; this doesn’t say lanes don’t work.
Streets losing the most bus time with under half the route on a bus lane:
| Street | Bus-hours lost / weekday | mph, 7 am–7 pm | Bus lane | Riders / weekday on these routes | Routes |
|---|---|---|---|---|---|
| Madison Av (Manhattan) | 126 | 5.7 | 36% | 39,426 | M1–M4 and 13 express routes |
| Flatbush Av (Brooklyn) | 122 | 6.6 | 9% | 16,803 | B2 B41 B9 Q35 |
| Broadway (Manhattan) | 119 | 5.5 | 32% | 55,782 | M4 M5 M10 M11 M55 M100 M104, Bronx locals, express |
| Queens Blvd (Queens) | 68 | 6.0 | 2% | 12,128 | Q59 Q60 QM18 QM64 |
| Jamaica Av (Queens) | 62 | 7.1 | 21% | 11,087 | Q54 Q56 Q110 |
| Fulton St (Brooklyn) | 60 | 5.6 | 48% | 13,036 | B20 B25 B26 B52 |
| Coney Island Av (Brooklyn) | 57 | 6.3 | 0% | 6,388 | B68 |
| Amsterdam Av (Manhattan) | 52 | 5.1 | 2% | 22,096 | M7 M11 M101 |
| 3 Av (Bronx) | 51 | 6.0 | 2% | 5,996 | BX15 BX21 |
| Nostrand Av (Brooklyn) | 50 | 7.2 | 36% | 11,336 | B44 B44 SBS |
| 5 Av (Brooklyn) | 46 | 5.2 | 0% | 5,693 | B63 |
| Avenue U (Brooklyn) | 43 | 6.3 | 0% | 8,481 | B3 B47 |
Per mile, the worst short stretches without lanes: Bay Pkwy (B6, 11 bus-hours per route-mile), E 167 St in the Bronx (BX35, 10), DeKalb Av (B38, 9), E 116 St (M116, 8), Flatbush Av (7), Columbus Av and York Av (7).
Streets that already have lanes but still lose the most: Manhattan’s 5 Av (175 bus-hours, 85% covered), 3 Av (99), Lexington Av (84), 1 Av (77) and 2 Av (62), the M15 SBS corridor. Paint alone doesn’t keep these clear; enforcement, signal priority or full busways are the next step there.
Caveats
Section titled “Caveats”- Timepoint stretches are long (often 1–2 miles, up to 6 on SBS routes) and can mix streets. Only 34% of the time lost is on stretches whose two stops share a street, so the street table leaves out a lot, including some long, slow stretches. Our own bus positions can split stretches into single blocks; that’s the next step.
- “Fastest hour” isn’t a target. Some delay is boarding, which no lane fixes, and late-night fastest hours can be faster than any street could manage at midday.
- Lane coverage counts a lane in either direction, and lanes that only run at peak hours. DOT’s file was last updated April 2026, so newer lanes may be missing.
- Riders are boardings on all the routes using a street, not riders on that street; use them for scale only.